Need help ?Address: FLAT/RM 803 CHEVALIER HOUSE 45-51 CHATHAM ROAD SOUTH TSIM SHA TSUI KL
Email: support@hkmlc.com

There are so many tools and techniques that can be applied to make a strategic choice for your business; using the right tool is what matters. More often than not, good decision-making depends on how well you process data for analysis. One of the tools for analysis and visualization through which you can compare data sets for informed decisions based on solid data is called the pyramid chart.

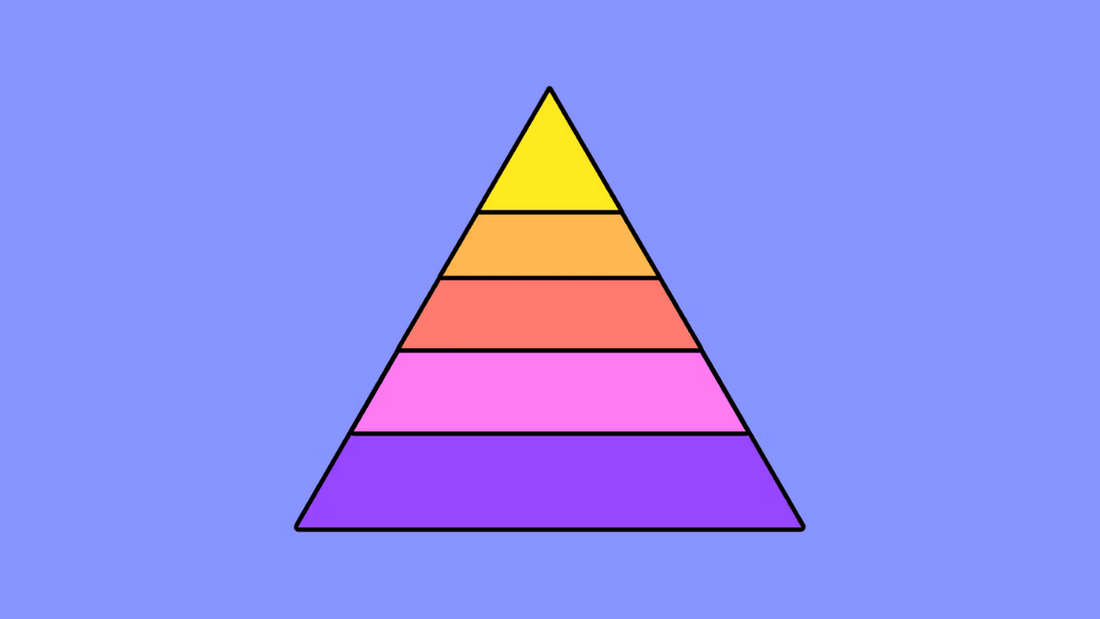
A pyramid chart, also referred to as a pyramid diagram or pyramid graph, is a graphical representation that uses the shape of a triangle or pyramid to compare many different data sets. The bottom of the pyramid represents the lowest value data point, while the top of the pyramid represents the highest value. When a set of values goes up or down, the width of each segment changes, making it effortless to see relative proportions.
Pyramid charts are useful for showing hierarchies, proportions, and multi-level processes. They can also be used to track trends in data over time or compare different categories. These charts are versatile enough to be applied across various industries, including business, education, healthcare, and marketing.
Some well-known examples of pyramid charts include Maslow's Hierarchy of Needs and the Food Pyramid. In Maslow’s model, human needs are organized into five layers, from basic physiological requirements to self-actualization at the top, clearly showing how data is structured hierarchically. The Food Pyramid similarly shows the proportion of different food groups that should be consumed for a healthy diet.
The pyramid chart organizes data hierarchically, where the lower sections of the pyramid represent lower-priority or lower-value data, while the top sections represent higher-priority or higher-value data. This makes it an effective tool for reading and understanding the flow of information or hierarchical processes.
For instance, how do you read a population pyramid? Population pyramids show the distribution of a population by age and gender, typically organized with the youngest population at the base and the oldest population at the top. Such charts help to understand population trends and predict future demographic changes.
A pyramid chart is logical by design: the broad base allows a large amount of low-priority data to be presented, while the narrow apex narrows down to the most important data. This structure is perfect for depicting organizational hierarchies, sales funnels, or even workflows.
A sales and marketing pyramid could show stages like:
Pyramid charts are widely used across many fields, including:
Pyramid charts are highly effective for comparing and contrasting data sets. The layered structure of a pyramid graph enables viewers to easily visualize how different categories stack up against each other. For example, a company can use a pyramid to compare sales performances across different departments or products.
The hierarchical structure of a pyramid chart makes it easier to digest and process complex data. The pyramid outline clearly illustrates the relationships between different data sets, making it ideal for presentations to stakeholders who may not be familiar with raw data.
Pyramid charts are excellent for representing large datasets in a simplified manner. The broad base allows you to accommodate vast amounts of data while the narrow apex highlights the most critical information. This structure makes it easy to identify trends and make comparisons.
Pyramid charts are effective for depicting hierarchical relationships. Whether illustrating a company's organizational structure or the steps in a sales cycle, pyramid charts make it easy to understand how different levels relate to one another.

Follow these steps to create a pyramid chart:
Decide which type of pyramid chart works best for your data. For instance, a traditional pyramid chart is great for showing hierarchies, while an inverted pyramid is better suited for top-down processes like sales funnels.
Group your data according to importance. For example, in strategic planning, place long-term goals at the top of the pyramid and daily tasks at the base.
Establish an order for your data from most important (top) to least important (bottom).
Sketch the pyramid outline on paper or digitally, ensuring each level logically fits within the pyramid structure.
Clearly label each section of the pyramid with the appropriate category, add colors for clarity, and use icons to represent different pieces of data where applicable.
Creating a pyramid chart is a team effort when dealing with large datasets or complex hierarchies. With HKMLC Interactive Whiteboard, the process is streamlined. HKMLC’s interactive whiteboard software offers pre-built pyramid templates and an infinite canvas for brainstorming, organizing, and presenting data. Teams can collaborate in real time, adding ideas and data points from anywhere in the world. Plus, everything is saved to the cloud, so your pyramid chart can be easily accessed and edited later.
Pyramid charts offer a powerful way to visualize data hierarchies, compare different data sets, and track trends. Whether you're working in business, education, or healthcare, pyramid charts can simplify complex datasets and make decision-making easier. Tools like the HKMLC Interactive Whiteboard take pyramid charting to the next level, offering seamless collaboration, real-time editing, and cloud-based storage for enhanced productivity.
The next time you're faced with organizing complex data or comparing hierarchical structures, let the pyramid chart be your guide and boost your team’s efficiency with HKMLC.
No comments
Where Visions Are Amplified!
Email: support@hkmlc.com
Phone: 1-877-947-8577
Adress: ROOM_1, 16/F EMPRESS PLAZA 17-19 CHATHAM ROAD SOUTH, TSIM SHA TSUI, HK


0 comments